In September 2026, a Disneyland guest in the United States posted a photo of a ticket with its price — and compared it with the cost of entry to the same park in 1971. The post made people think about real dollar inflation; the difference looked colossal to many. The price tag rose 5,300% over 50 years.
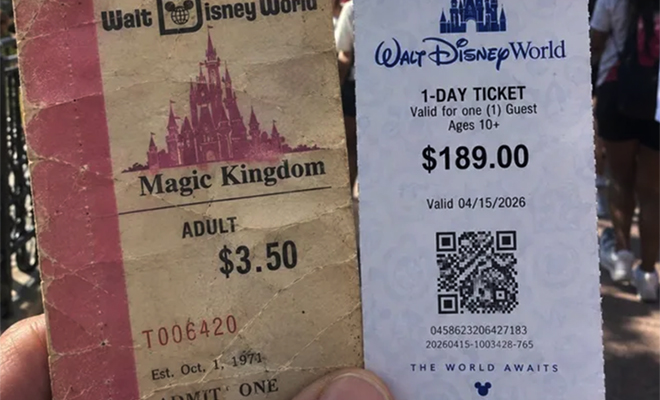
The ticket price climbed from $3.50 to $189.00 — more than 54 times over. But you cannot rely on that figure alone when calculating inflation: observers online already noted that in 1971, three dollars bought entry to the park grounds only. In 2026, $189 gets you rides on the attractions as well. To understand how the dollar actually lost value, it is easier to look at the official CPI index.
What the Official CPI Index Shows
US government statistics measure the devaluation of money through the Consumer Price Index (CPI), which tracks the cost of a fixed basket of basic goods and everyday services.
- Overall figure: Over the last half-century, cumulative CPI growth totaled about 488%.
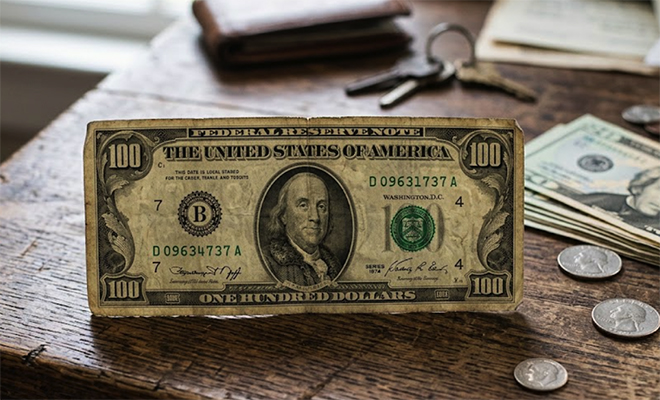
- Purchasing power: A $100 US bill in the mid-1970s is formally equivalent to roughly $600 today by official government calculations.
- Average annual rate: Official reports record moderate inflation of 3.5% to 3.9% per year.
If you rely exclusively on these official figures, the American currency shrank smoothly, without catastrophic spikes, retaining its status as a reliable vehicle for long-term savings.
How Asset Prices Changed
The problem with the official index is that an ordinary person does not buy an abstract statistical basket but specific goods that shape the level and quality of life. Look at key assets and the picture changes radically.

- Home ownership: The average cost of a residential house in the United States fifty years ago was about $44,000. Today a comparable family home costs buyers more than $420,000. Real estate rose nearly tenfold, outpacing baseline inflation by almost double.
- Higher education: A year of study at an American university in the 1970s cost on average $2,100. Today one year at a prestigious college easily exceeds $35,000–40,000. That means a price increase of more than 16–18 times.
- Gold and physical assets: In the mid-1970s, a troy ounce of pure gold traded around $125. Today the same bar on the exchange fetches over $2,500, showing a twentyfold drop in paper cash purchasing power relative to the precious metal.
Per-capita spending on health insurance and complex medical care rose more than 12 times, turning quality treatment into a serious financial test.
The Mechanics of Manipulation: Why Government Indices Mislead
Where does the colossal gap between government reports and real-life price tags come from? It lies in the CPI calculation methodology itself, which has been regularly modified since the 1980s.
- Substitution effect: If beef tenderloin rises sharply in price, the mathematical model assumes the consumer simply switches to cheaper chicken. In the statistical report, the «cost of lunch» stays the same, although the person is in fact forced to lower the quality of their diet.
- Hedonic adjustments: Statisticians reduce the final price index to account for technological progress. If a new smartphone costs thirty percent more than the old model but has a processor four times more powerful, the algorithm may count that as physical «deflationary cheapening.»
- Exclusion of capital: The government index does not account for direct purchase of land, securities, or primary housing at all — instead, the formula includes only a hypothetical rental equivalent cost.
True cumulative US dollar inflation over 55 years (from 1971 to 2026) is about 727% (an average of 3.9% per year by the official Consumer Price Index). The purchasing power of $1 in 1971 is equivalent to roughly $8.27 in 2026.
Comparing official statistics with the real market clearly showed that the US dollar lost about 90% of its value over half a century. That level of inflation is high enough.